2015 Spring Reports of the Auditor General of Canada—Image Descriptions
2015 Spring Reports of the Auditor General of Canada Image Descriptions
Exhibit 3.1—Main components of government spending
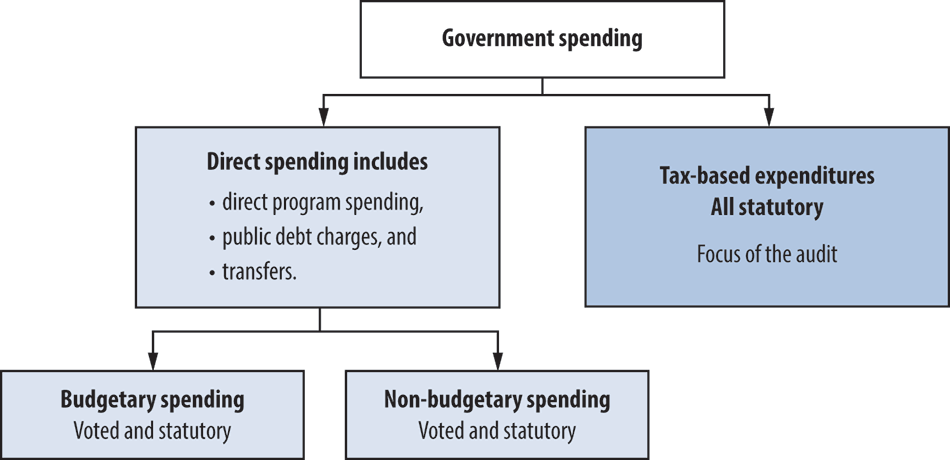
The chart shows that the government divides its spending in two ways: direct spending and tax-based expenditures. Direct spending includes direct program spending, public debt charges, and transfers. It is broken down further into budgetary spending (such as operating expenditures) and non-budgetary spending (such as government loans). Budgetary and non-budgetary spending is approved in one of two ways: they are either voted by Parliament or are authorized under specific legislation (statutory). Tax-based expenditures (such as tax credits) are all statutory.
(Return)
Exhibit 4.1—Nursing stations provide the first point of contact for health services in remote First Nations communities
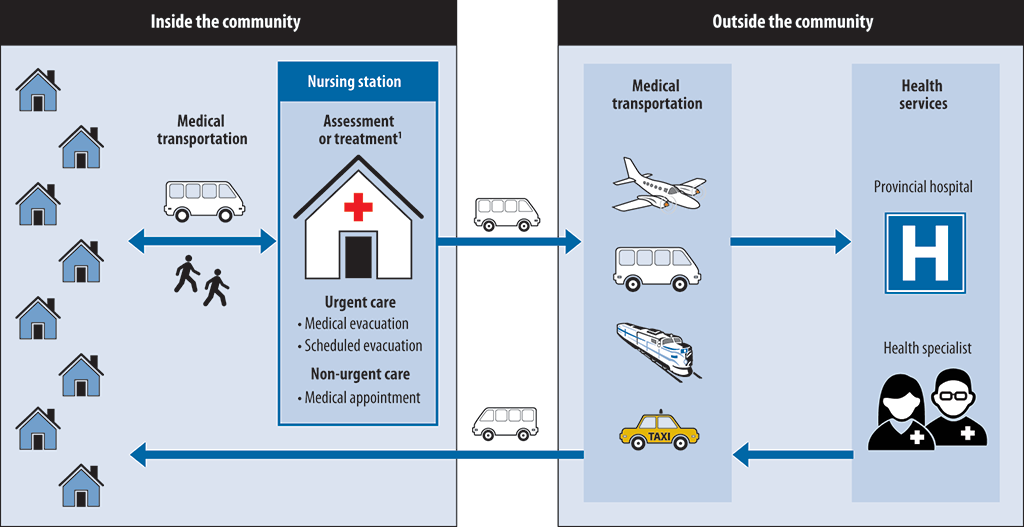
This diagram shows how nursing stations in remote First Nations communities help patients receive the health services they need: either inside or outside the community. Within the community, patients come to the nursing station from their homes by their own means or by means of medical transportation. At the nursing station, nurses first assess whether patients require urgent or non-urgent care. To help them with assessment or treatment, nurses may be required to consult a physician directly, either by telephone or by video conference. Non-urgent cases may require a medical appointment inside or outside the community. Urgent cases may require medical or scheduled evacuations. In those cases, personnel at the nursing station arrange the necessary medical transportation—such as taxi, train, bus, or plane—to access health services outside the community at provincial hospitals or where health specialists are available. Patients then return to their communities by means of medical transportation.
Source: Based on Health Canada information
(Return)
Exhibit 5.2—Canada Border Services Agency’s portfolio management life cycle has seven phases
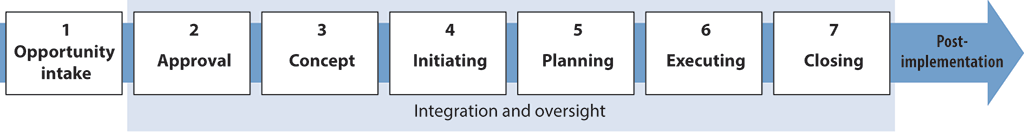
This chart shows the seven phases of Canada Border Services Agency’s portfolio management life cycle, from opportunity intake, to approval, concept, initiating, planning, executing, and closing. These are accompanied by integration and oversight. After these phases are completed, post implementation takes place.
The information for this exhibit was adapted from Canada Border Services Agency Project Portfolio Management Framework, Figure 7.
(Return)
Exhibit 6.1—Offenders are eligible for release before the end of their sentence
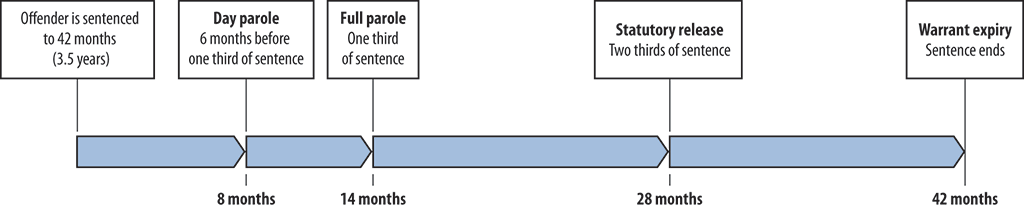
The chart shows when offenders are eligible for release before the end of their sentence.
Except for offenders serving life sentences, the average offender in the 2013–14 fiscal year, received a sentence of 42 months or 3.5 years. Offenders are eligible for day parole 6 months before serving one third of their sentence, or 8 months into an average sentence. Offenders are eligible for full parole after serving one third of their sentence, or 14 months into an average sentence. Offenders are eligible for statutory release after serving two thirds of their sentence, or 28 months into an average sentence. If not released at the previously mentioned times, an offender is released when his warrant expires, which is when his sentence ends—after 42 months for an average sentence.
(Return)
Exhibit 6.2—In the 2013–14 fiscal year, the majority of offenders were first released from penitentiary at their statutory release date
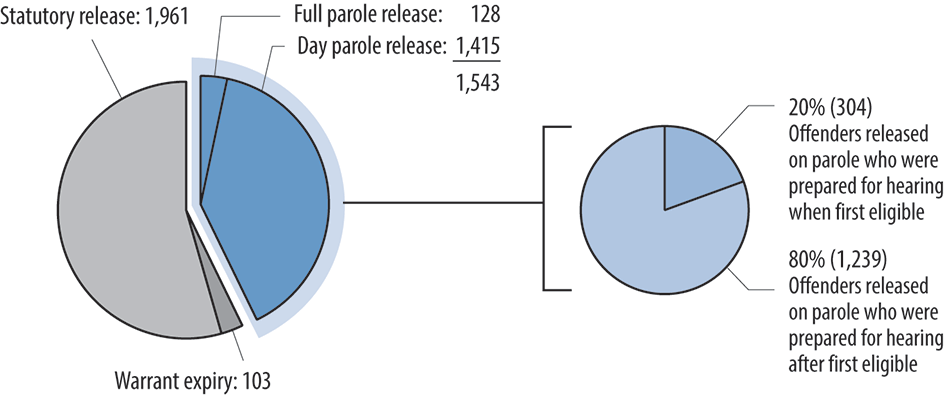
In the 2013–14 fiscal year, the majority of offenders were first released from penitentiary at their statutory release date. A total of 1,961 offenders were granted statutory release, 128 were granted full parole release, 1,415 were granted day parole release, and 103 were released when their warrants expired. Of those granted full parole and day parole release, 20 percent, or 304 offenders, were prepared for their hearings when they were first eligible. Eighty percent, or 1,239 offenders, were not prepared for their hearing until after they were first eligible for parole.
(Return)
Exhibit 6.3—Offenders released on parole are less likely to be convicted of a violent offence before their sentence ends than offenders on statutory release
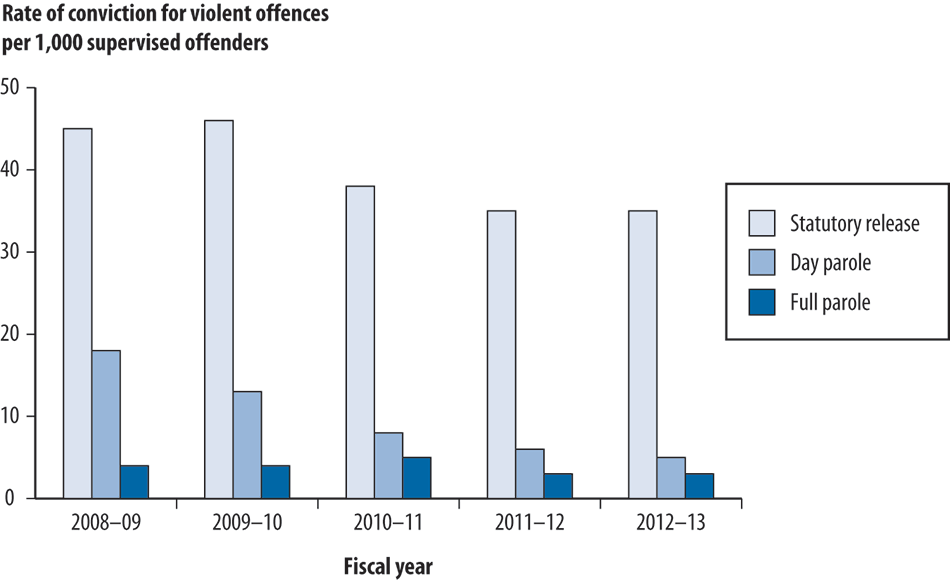
The chart shows that offenders released on parole are less likely to be convicted of a violent offence before their sentence ends than offenders on statutory release. The rate of conviction for violent offences per 1,000 supervised offenders between the 2008–09 fiscal year and the 2012–13 fiscal year shows that offenders on statutory release were between 3 and 7 times more likely to offend than offenders on day parole and between 7 and 11 times more likely to offend than offenders on full parole. Offenders on day parole were up to 5 times more likely to offend than offenders on full parole.
(Return)
Exhibit 7.1—Increased turnover and sick leave resulted in fewer timely closures of investigation files
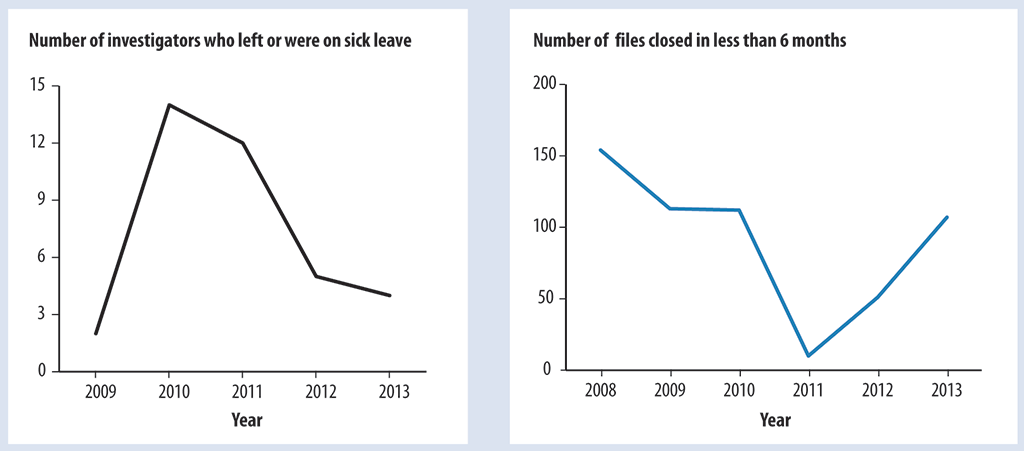
The first graph shows the number of investigators who left or were on sick leave between 2009 and 2013. The second graph shows the number of files closed within six months during the same period, between 2008 and 2013. The more investigators who were missing, the fewer the number of files closed within six months. The following table provides the data for each of the years from 2008 to 2013.
| Year | Number of investigators who left or were on sick leave | Number of files closed in less than 6 months |
|---|---|---|
| 2008 | Not available | 154 |
| 2009 | 2 | 113 |
| 2010 | 14 | 112 |
| 2011 | 13 | 10 |
| 2012 | 5 | 51 |
| 2013 | 4 | 107 |
Sources: Information obtained from the Office of the Ombudsman for the Department of National Defence and the Canadian Forces, and from National Defence
(Return)